Posted on January 23, 2013 in Cabbagetown
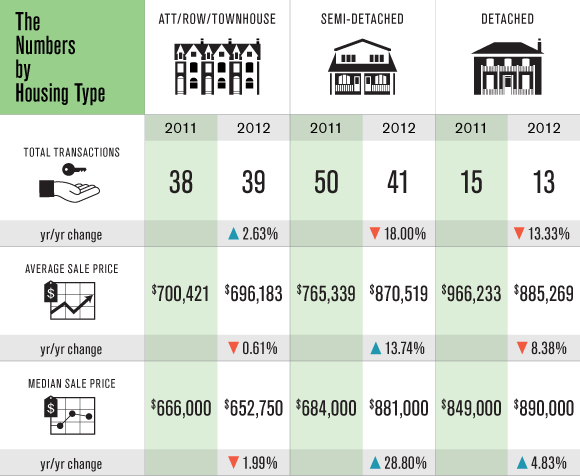
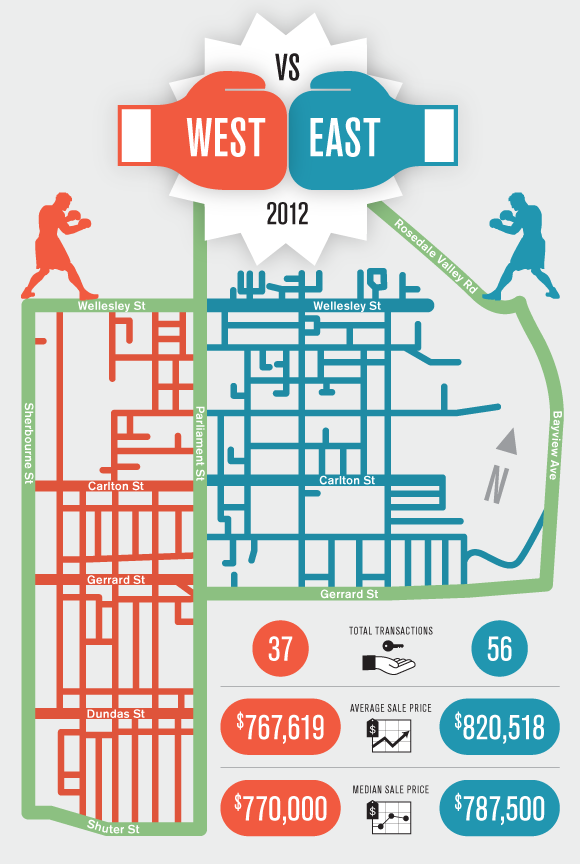
Based on Freehold Residential Real Estate Transactions that occurred in Cabbagetown only; Cabbagetown is outlined in the very cool map provided.
All transactions by housing type in 2012 compared to 2011

We decided that Cabbagetown deserved its own market analysis and that it was tired of being lumped in with a Toronto Real Estate Boards district known as “C8”. C8 extends all the way west to Yonge St. and south to the lake. Printing off all the stats in the TREB district C8 is not an accurate reflection of the Cabbagetown Real Estate Market. This is. All data was pulled manually and every sale actually occurred in Cabbagetown.
2012 Transactions East and West of Parliament Street

The depiction of a boxing match is not intended to create animosity between the residents of east and west Cabbagetown; it is simply meant to be awesome.
For more detailed information or questions about your properties value, contact us. We’d love to hear from you.
Nicholas Humphries 416-526-2791, nick@nickandhilary.com
Hilary Browning 416-735-4665, hilary@nickandhilary.com
This analysis is of residential freehold properties that were sold via the MLS system in the calendar years 2011 and 2012. Statistics were self compiled. All properties with a commercial component, as well as multi-unit residential properties, were excluded. Multi-unit residential properties are defined as any property with 3 or more kitchens for the purpose of this analysis.


